Logs
DETAILS: Tier: Ultimate Offering: GitLab.com Status: Beta
- Introduced in GitLab 16.10 with a flag named
observability_logs. Disabled by default. This feature is in beta.- Feature flag changed in GitLab 17.3 to the
observability_featuresfeature flag, disabled by default. The previous feature flag (observability_logs) was removed.
FLAG: The availability of this feature is controlled by a feature flag. For more information, see the history. This feature is available for testing, but not ready for production use.
GitLab supports centralized application and infrastructure logs collection, storage, and analysis. GitLab Logging provides insight about the operational health of monitored systems. Use logs to learn more about your systems and applications in a given range of time.
Configure logging
Configure logging to enable it for a project.
Prerequisites:
- You must have at least the Maintainer role for the project.
-
Create an access token and enable logs:
- On the left sidebar, select Search or go to and find your project.
- Select Settings > Access tokens.
- Create an access token with the following scopes:
read_api,read_observability,write_observability. Be sure to save the access token value for later. - Select Monitor > Logs, and then select Enable.
-
To configure your application to send GitLab logs, set the following environment variables:
OTEL_EXPORTER = "otlphttp"
OTEL_EXPORTER_OTLP_LOGS_ENDPOINT = "https://observe.gitlab.com/v3/<namespace-id>/<gitlab-project-id>/ingest/logs"
OTEL_EXPORTER_OTLP_LOGS_HEADERS = "PRIVATE-TOKEN=<gitlab-access-token>"
Use the following values:
-
namespace-id- The top-level group ID that contains the project -
gitlab-project-id- The project ID -
gitlab-access-token- The access token you created
-
Logs are configured for your project. When you run your application, the OpenTelemetry exporter sends logs to GitLab.
View logs
You can view the logs for a given project:
- On the left sidebar, select Search or go to and find your project.
- Select Monitor > Logs.
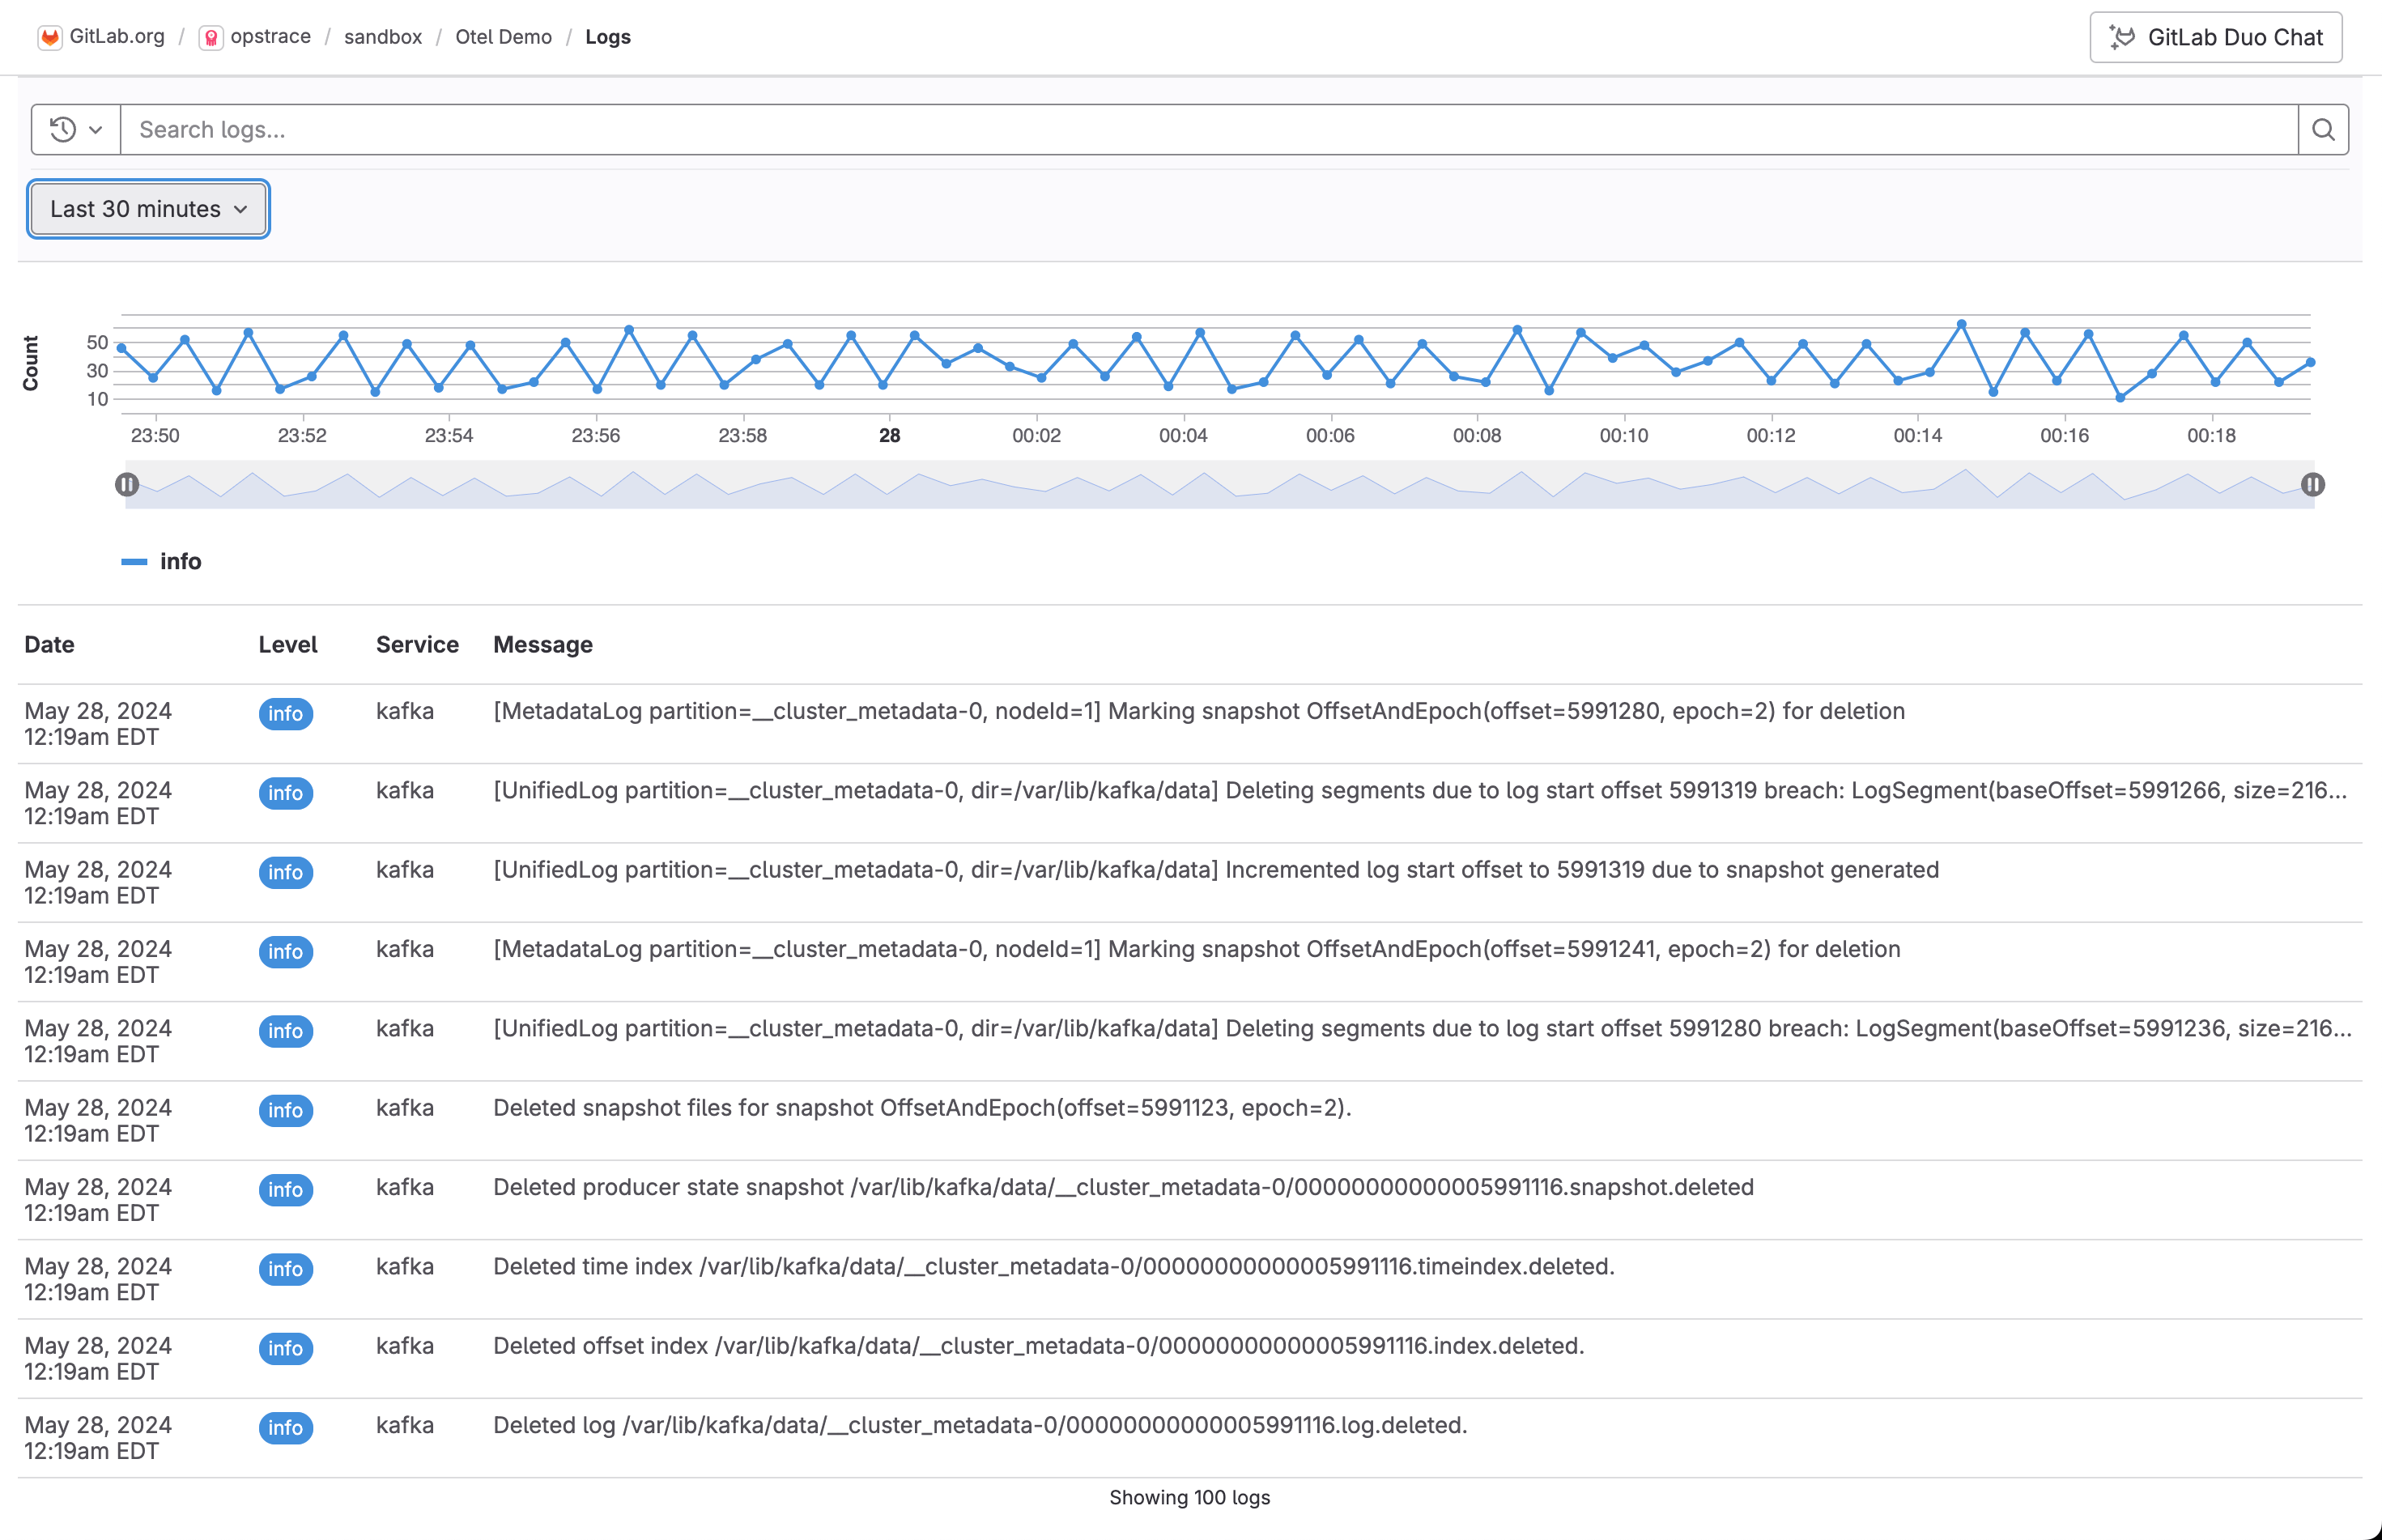
A list of logs is displayed. Currently log date, level, service, and message are supported. Select a log line to view its details.
You can either filter logs by attribute or query log strings with the search bar. The log volume chart at the top shows the number of logs ingested over the given time period.
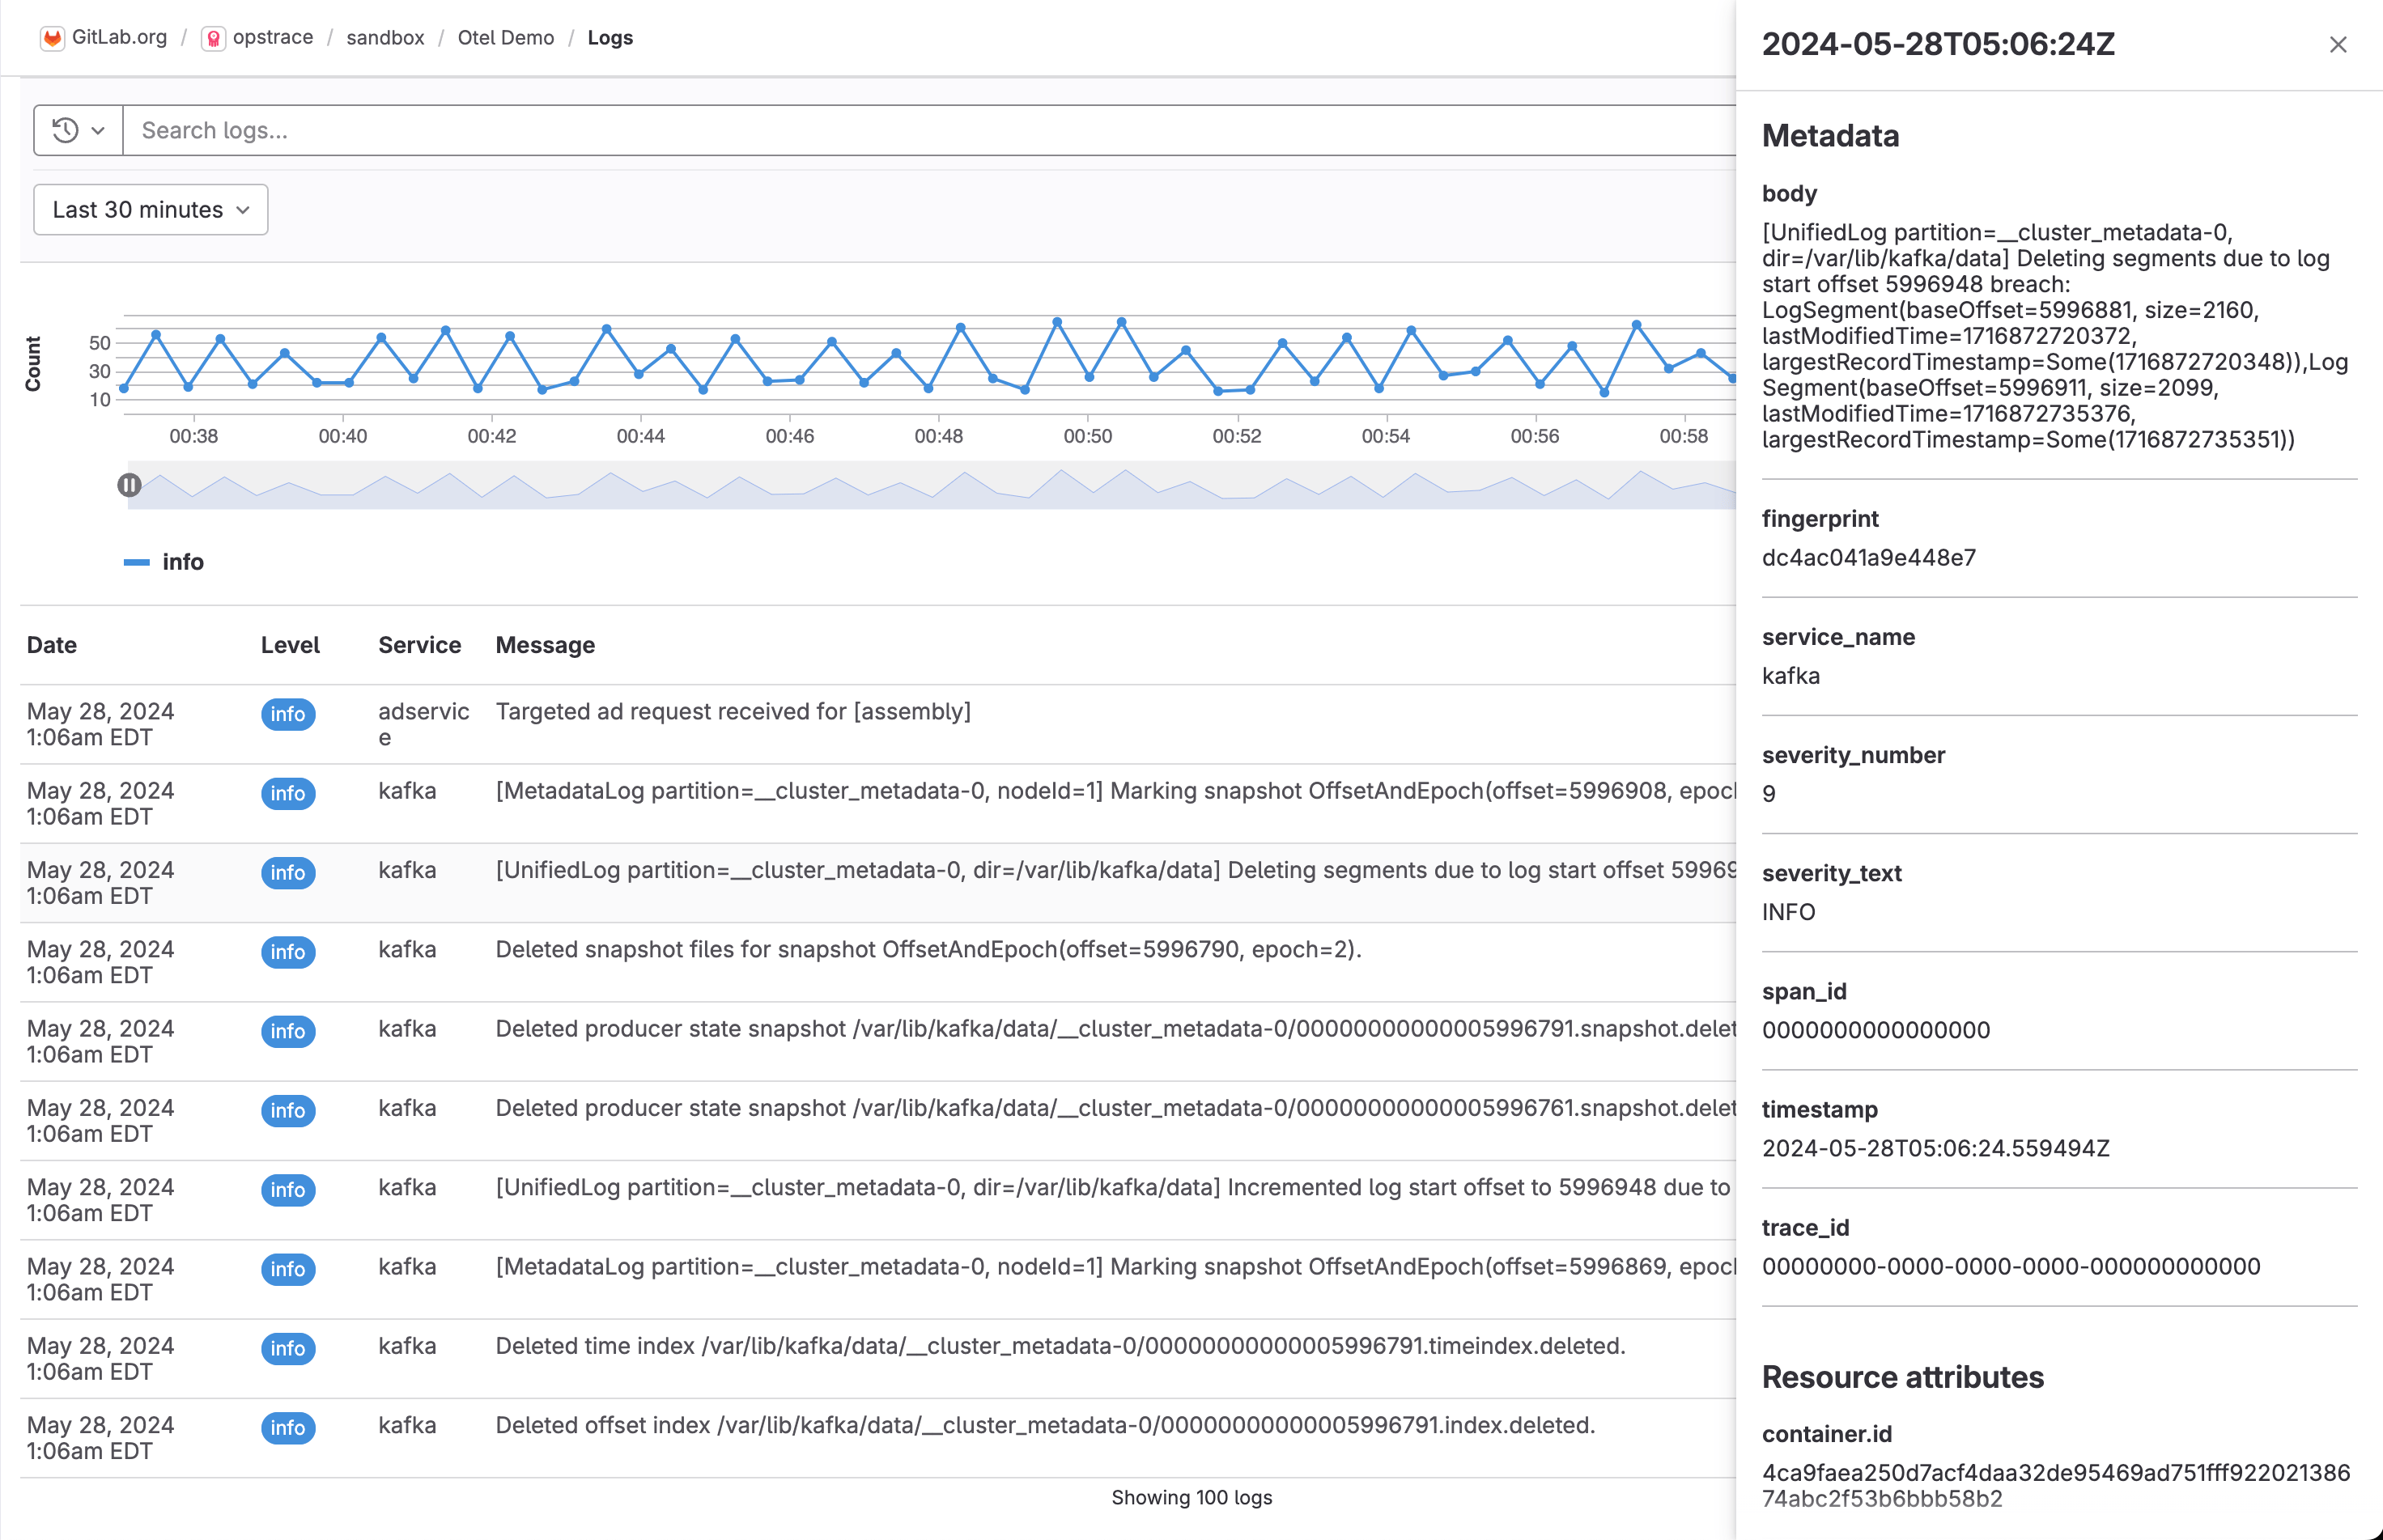
View logs details
It is also possible to see log line details such as metadata and resource attributes.